ExoQuick ULTRA EV Isolation Kit
The need for a post-isolation clean-up is thus very clear. And that’s exactly why we came up with ExoQuick ULTRA.
EVs isolated with ExoQuick ULTRA display a morphology you’d expect with EVs (Image 3.1).
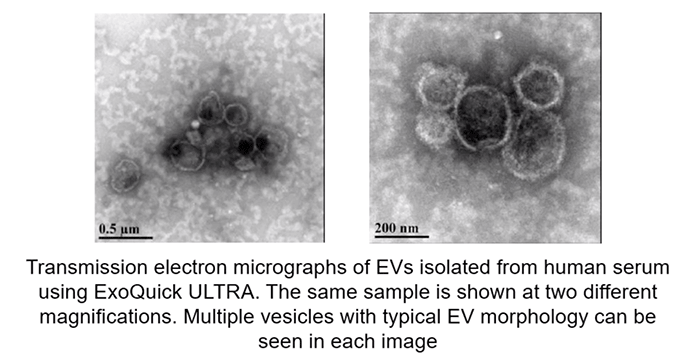
Image 3.1: EVs Isolated with ExoQuick ULTRA Display Typical EV Morphology.
Taken from powerpoint slide show. Please provide a citation.
With ExoQuick ULTRA you’re also able to significantly reduce the amount of background and contaminating proteins, like albumin and IgG. Consequently, the detection of exosomal markers (e.g. CD9, CD81, and Hsp70) is significantly increased compared to other commercially available kits and ultracentrifugation (Diagram 3.8).
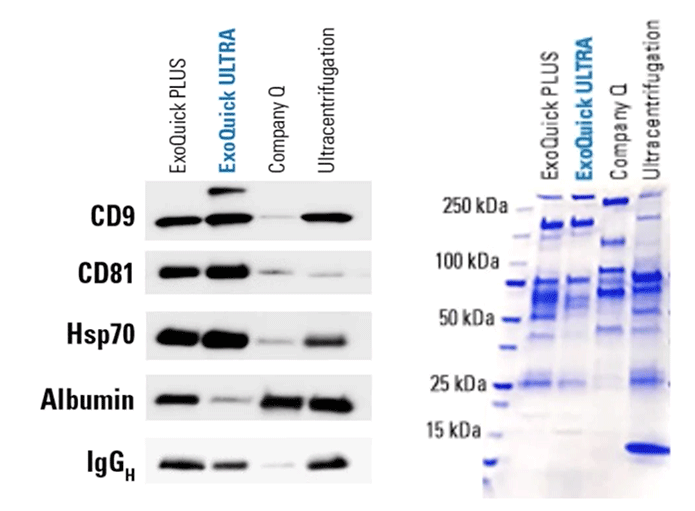
Diagram 3.8: Increased Purity with ExoQuick ULTRA. A coomassie blue-stained protein gel comparing the protein content of exosome preps isolated using different methods shows only a few, defined protein bands in the ExoQuick ULTRA lane compared to the other methods. Western blotting of the gel shows that the ExoQuick ULTRA prep contains the highest levels of exosome-specific markers CD9, CD81, and Hsp70 and the lowest levels of the carryover proteins albumin and IgGH. In contrast, the prep from Company Q appears to be primarily albumin, and even the sample prepared using ultracentrifugation contains considerably higher levels of both albumin and IgGH. Each lane was loaded with 7 μg of total protein as measured using a fluorometric Qubit protein assay.
From SBI
This is because, as we remove albumin and IgG, we end up loading relatively higher amounts of EVs than with other EV preps.
ExoQuick ULTRA also allows you to increase your yield. This enables you to isolate more EVs per normalized input volume and per milligram of protein as compared to other commercially available kits or ultracentrifugation (Diagram 3.9).
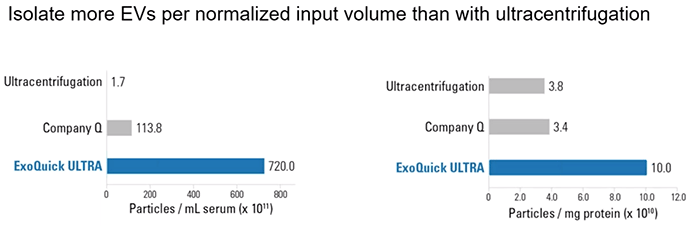
Diagram 3.9: Increased Purity with ExoQuick ULTRA Compared to Alternative Methods.Fluorescent nanoparticle tracking analysis (fNTA) demonstrates the high EV yields delivered by ExoQuick ULTRA compared to ultracentrifugation. Comparison of different isolation methods on EV yields by both volume of input serum (per mL, A) and amount of input serum protein (per mg as measured by fluorometric Qubit protein assay, B). Particle number was measured using fNTA, a technique which specifically detects EVs.
From SBI.
How can you harness the power of ExoQuick ULTRA?
There’s actually a very easy protocol you can follow (Diagram 3.10).
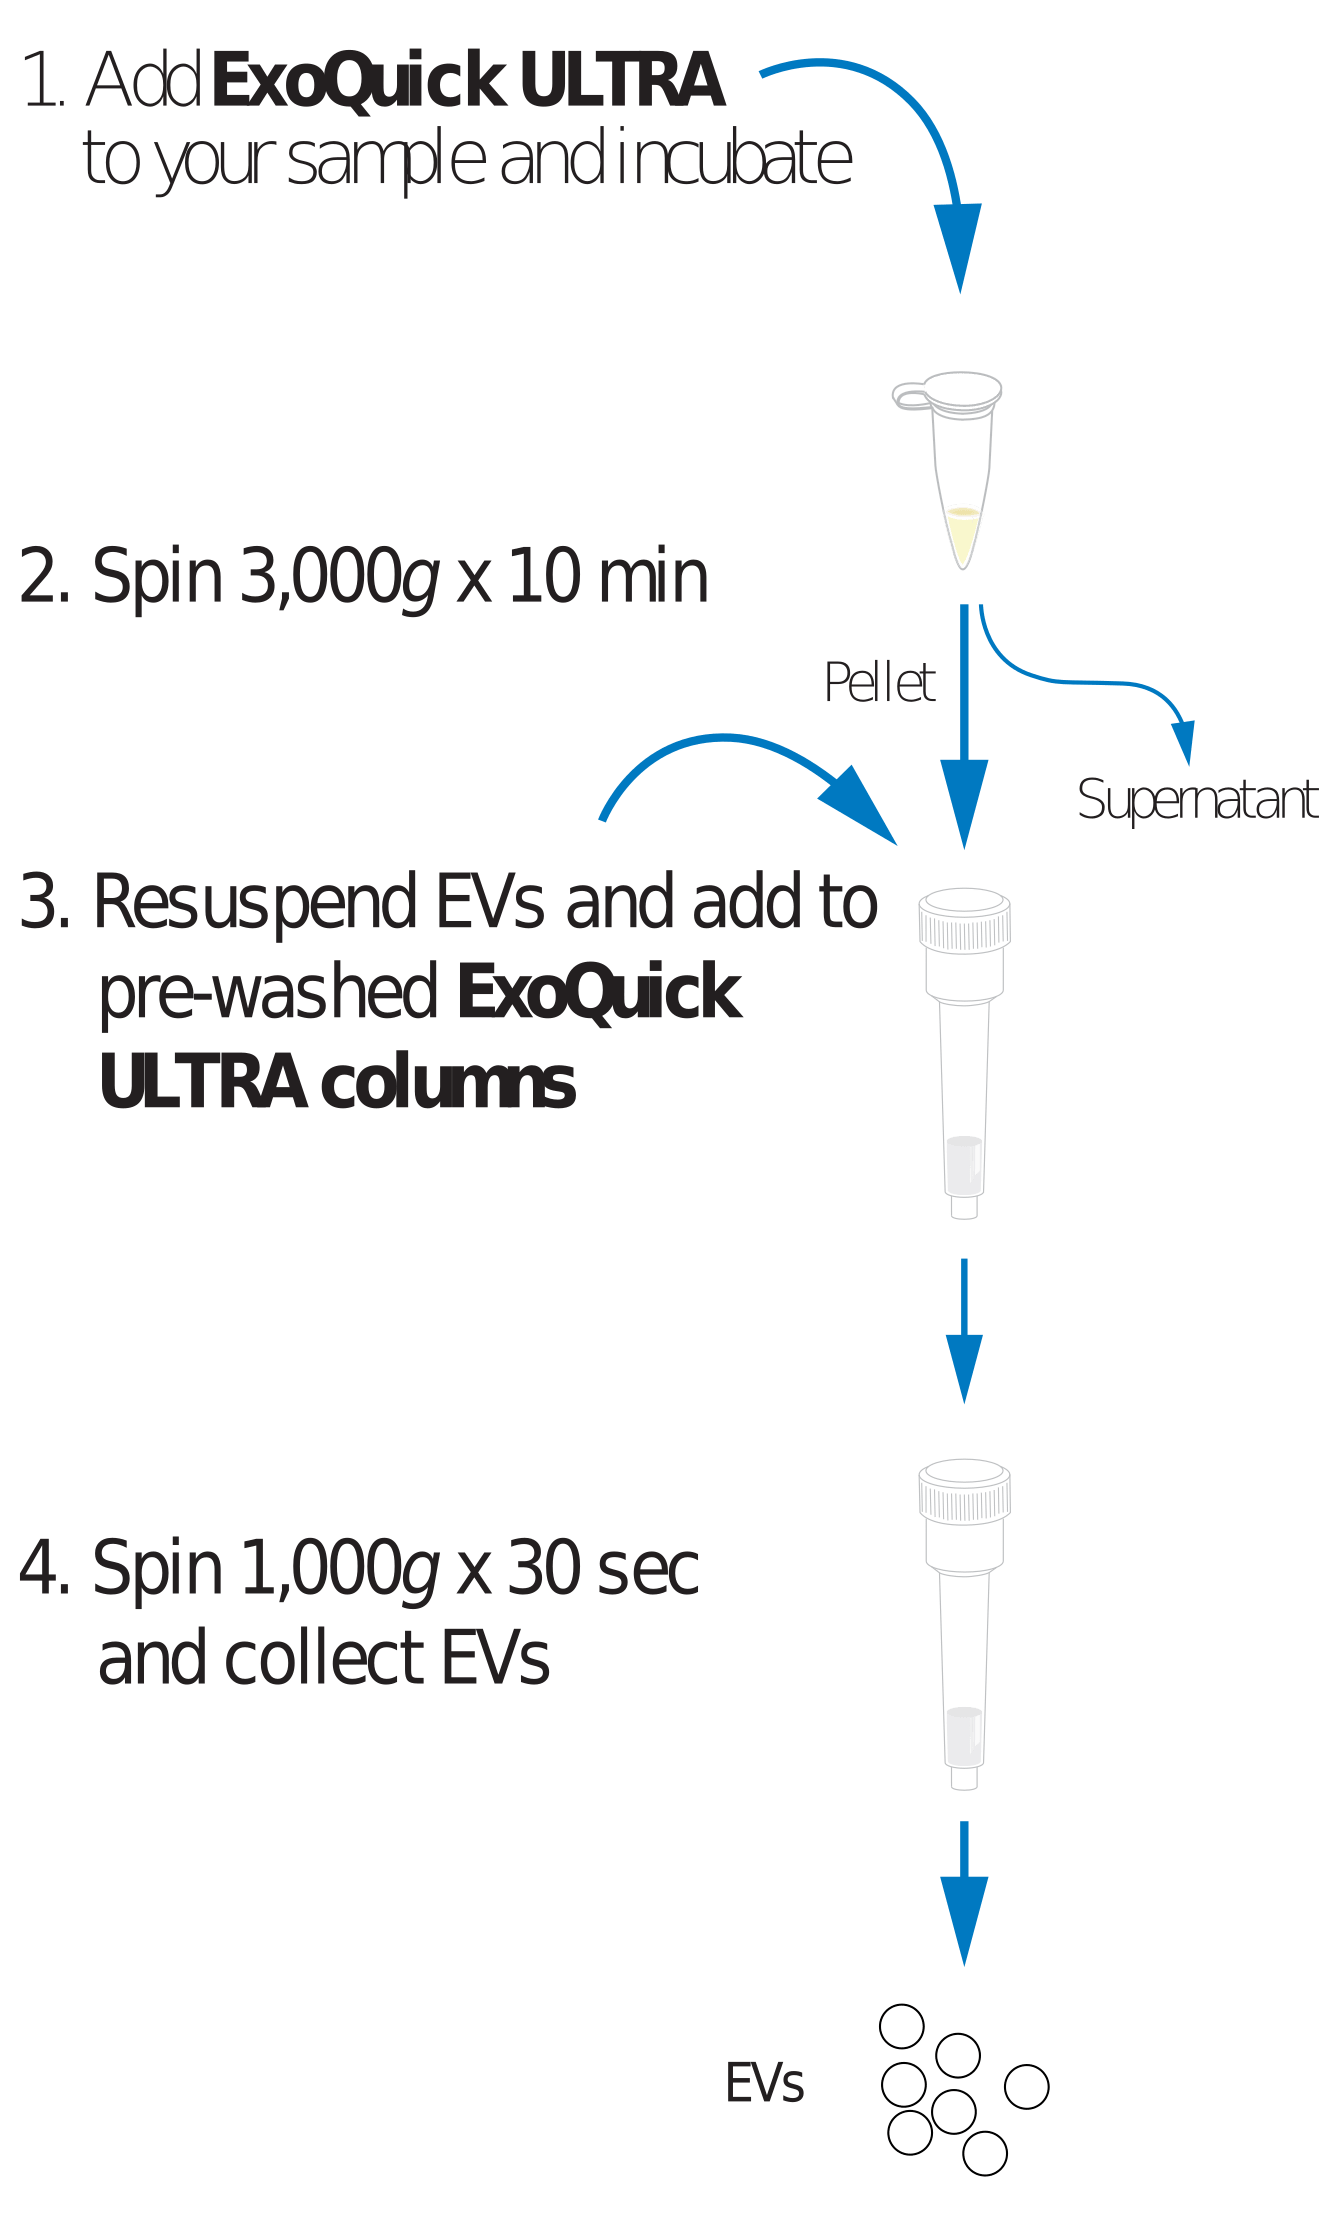
Diagram 3.10: ExoQuick ULTRA -How does it work?
From SBI.
- Add ExoQuick ULTRA to 250 µL of serum or plasma and incubate for 30-minutes at 4oC
- Collect EVs by spinning at 3,000g for 10 minutes
- Resuspend EVs and add to pre-washed ExoQuick ULTRA columns
- Spin 1,000g x 30 sec and collect EVs—they are now ready to use
The main advantages of ExoQuick ULTRA are:
1. ExoQuick ULTRA results in cleaner preps
2. ExoQuick ULTRA increases the yield of EV isolation when starting with the same amount of material as compared to ultracentrifugation or other kits.
This allows for fast, cost-effective, and improved biomarker detection.
Download the Ebook
Click here to download the pdf version of the ebook