Challenges of EV biomarker discovery
As you can imagine given the aforementioned discussion, there are numerous challenges with respect to the use of EVs for biomarker discovery.
The two main components of EVs are RNAs and proteins; we’ll start with the challenges surrounding the former and then move on to those involving the latter.
Exosomal RNA is mainly comprised of species between 20-200 nt; including microRNAs, lncRNAs, mRNAs, and so on (Diagram 3.2).
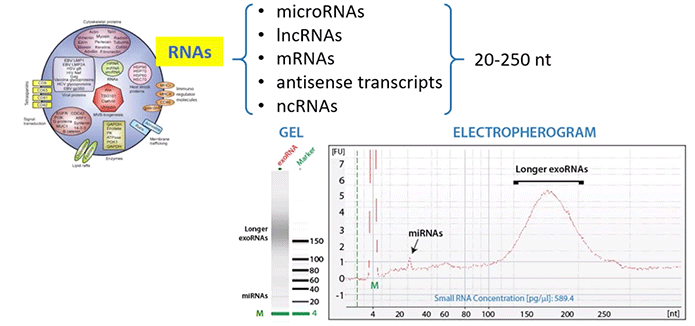
Diagram 3.2: Exosomal RNA Challenges: Concentration & Composition.
Taken from powerpoint slide show. Please provide a citation.
One of the challenges here is that concentrations are going to be very low. At the same time, we need to be sure that we’re identifying the RNA found within exosomes instead of other possibilities, like freely circulating RNA.
Additionally, it’s important to take into account that the make-up of exosomal RNAs is going to vary a lot between individuals and between sample types.
As a case in point: in one paper, exosomal RNA was assessed from serum and urine samples. There was a clear distinction between the two sample types. For instance, the serum sample was far richer in microRNAs than the urine sample. Yet there was plenty of intraindividual variabilities as well (Diagram 3.3).
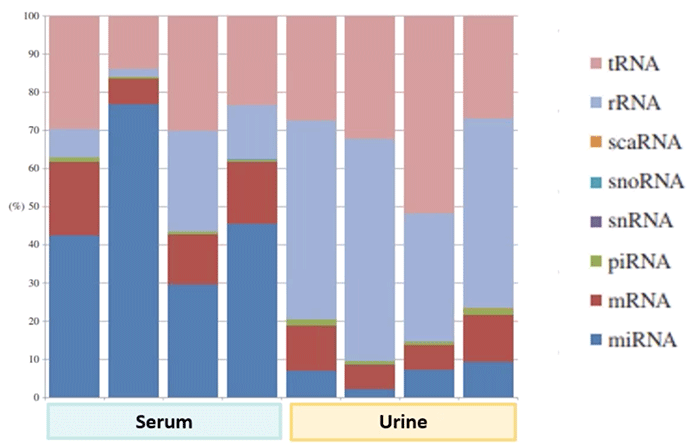
Diagram 3.3: Class Make-up of Exosomal RNAs.
At SBI we generated some interesting data using our Exo-NGS service with respect to all of this. We found that, just as before, the composition of exosomal RNA can vary enormously between different types of samples (Diagram 3.4).
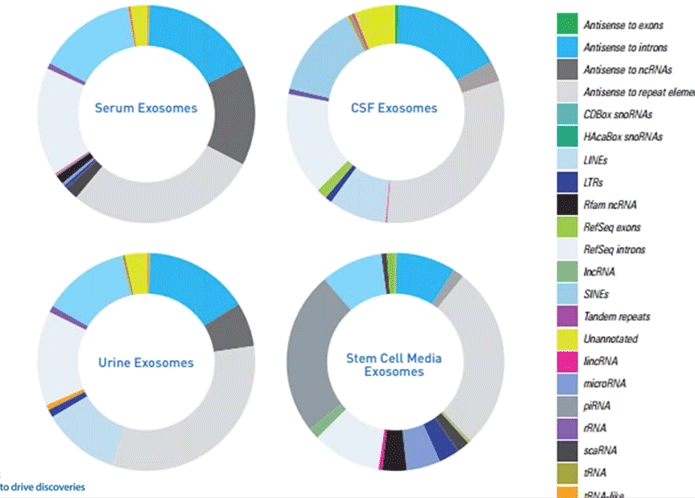
Diagram 3.4: Class Make-up of Exosomal RNAs in Body Fluids.
From SBI
Thus, the number of samples that one uses to try to assess or come up with a novel biomarker is very important.
Just as well, the way one treats the sample, the processing, and the isolation; all of these factors are going to affect the final make-up and composition of the exosomal RNA and thus the entire process of biomarker discovery.
As for proteins, there’s a wide range of them within exosomes as well. They include cytoskeletal proteins, enzymes, and signal transduction proteins among many others (Diagram 3.5).
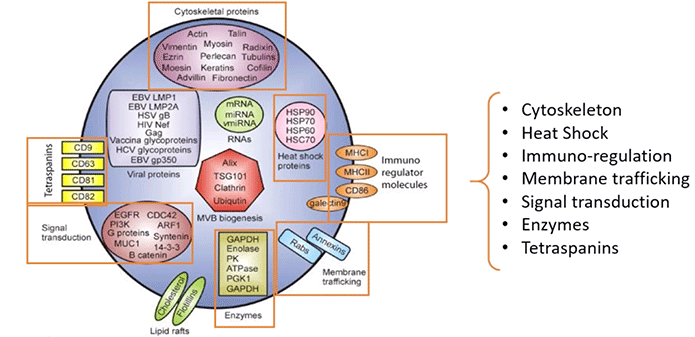
Diagram 3.5: Exosomal Proteins.
Taken from powerpoint slide show. Please provide a citation.
The current approaches used to characterize the proteins in EVs include western blotting, protein arrays, and mass spectrometry.
Western blotting is easy to perform and there are plenty of antibodies available. So if you know which protein you’re targeting, western blotting is great. However, if you’re involved in biomarker discovery then you should keep in mind that the use of western blotting is pretty limiting; it’s low-throughput and you can only assess the IDs of known markers.
Protein arrays, however, have the advantage of being scalable; with low to mid-throughput and there are many commercially available panels. That being said, protein arrays are expensive, there’s quantitation bias and, again, you’re only able to ID known markers.
Finally, there’s mass spectrometry; which is the most comprehensive approach. It’s a method of unbiased protein quantification. Of course, it’s quite complex, requires expertise, and is of a high cost. Not to mention: it’s extremely sensitive to contaminating proteins in the sample.
Place all of this in the context of the typical protein profile in serum and plasma; which contains more than 50% albumin. In contrast, the pool of low abundance proteins makes up roughly 5%-10% of the total proteins (Diagram 3.6). So it’s very difficult to find these biomarkers within samples such as these, given their propensity for large quantities of background and contaminating proteins.
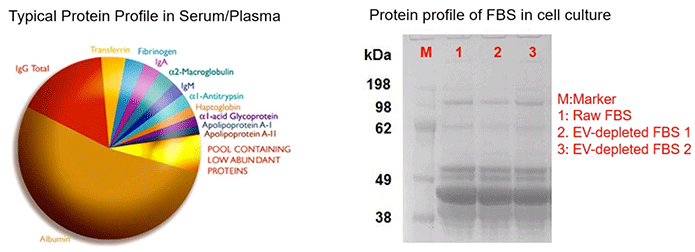
Diagram 3.6: What’s in Your Sample? Challenges of EV Protein Biomarker Discovery.
Taken from powerpoint slide show. Please provide a citation.
To get a more practical read into the implications of this for your research, we generated some data about this in-house, where we compared the mass spec of either a standard prep or an ExoMS surface protein capture kit that we offer (Diagram 3.7). The percentage of reads that map to either apolipoproteins, fibronectin, IgG, or serum albumin when there’s no post-isolation clean-up is extremely high. Over 45% of all the reads.
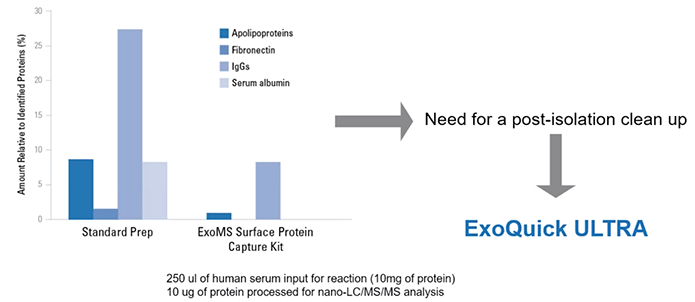
Diagram 3.7: Protein Background Detected by Mass Spec.
From SBI
So if you’re performing expensive mass spec where almost half of your reads are of background proteins, you may be missing out on very important biomarkers!
Download the Ebook
Click here to download the pdf version of the ebook